Sonifying IR spectroscopy data - finding peaks
Emperor Joseph II: Well, I mean occasionally it seems to have, how shall one say? [he stops in difficulty; turning to Orsini-Rosenberg] How shall one say, Director? Orsini-Rosenberg: Too many notes, Your Majesty? Emperor Joseph II: [to Mozart] Exactly. Very well put. Too many notes. From Amadeus (1984)
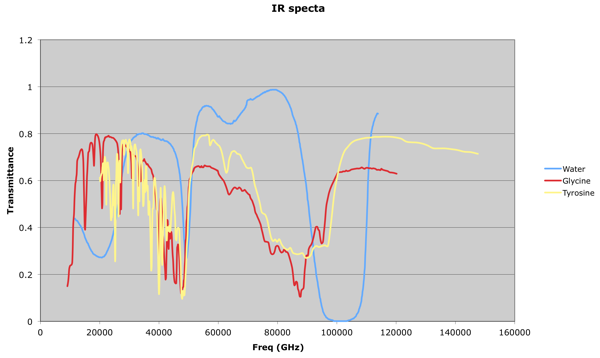
It occured to me after a while that my previous attempts at dealing with these sets of data were running into a 'too many notes' problem: 784 resonators at once is always likely to sound like noise! What one would like to be able to do would be to focus in on the visible 'peaks':
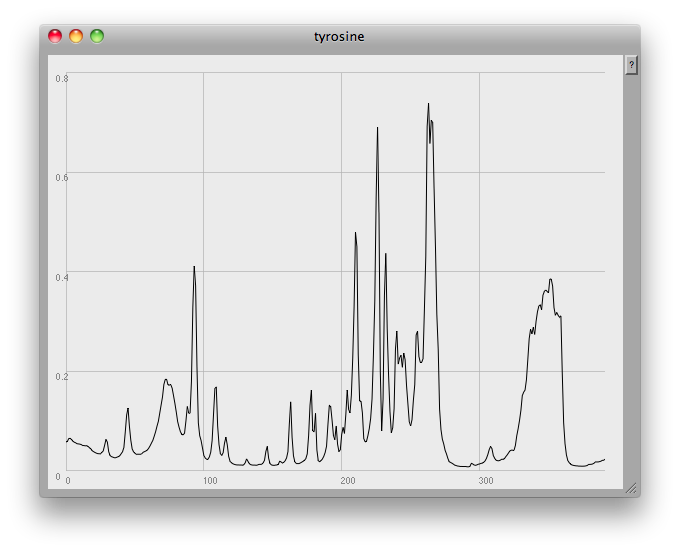
This is something a human can do quite intuitively: in fact, I seem to dimly remember that, many years ago, when I worked with HPLC (High Performance Liquid Chromatography) data at Schweppes, there was a pencil and paper method we used to estimate the height and width of a peak, and thus determine the concentration of a compound by calculating the area under the graph.
A little research into the problem of doing this algorithmically rapidly took me far out of my mathematical depth:
Chao Yang, Zengyou He, Weichuan Yu Comparison of public peak detection algorithms for MALDI mass spectrometry data analysis BMC Bioinformatics. 2009; 10: 4. Published online 2009 January 6. doi: 10.1186/1471-2105-10-4 http://www.ncbi.nlm.nih.gov/pmc/articles/PMC2631518/
Instead, I got some hints on a rather simpler approach from Daniel Mayer by asking a question on the SuperCollider mailing list.
Here's the code I eventually came up with:
(
~name = "glycine";
~path = Document.current.dir.asString++"/"++ ~name ++".csv";
f = CSVFileReader.readInterpret(~path);

f = ((f.flop[1] * -1) + 1).normalize;

f = (f*100).asInteger;
f = f.differentiate.removeEvery([0]).integrate;
f = f/100;

~peaksIndices = f.differentiate.sign.findAll([1,-1]);

g = Array.fill(f.size, 0);

~peaksIndices.do { |i| g[i] = f[i] }; // Daniel's line

~amps = g;

// [f,~amps].plot(~name, Rect(840,0,600,450));

~freqs = (36..128).resamp1(f.size).midicps;

SynthDef(\glycine, { | gate=1, amp |
	var env, sig;
	sig = Klank.ar(`[~freqs, ~amps, nil], PinkNoise.ar(amp/100));
	env = EnvGen.kr(Env.perc, gate, doneAction: 2);
	Out.ar(0, Pan2.ar(sig, 0, env))
}).add;

Pbind(	\instrument, \glycine,
		\amp, Pseq(~amps, 4).collect { |amp| if(amp > 0) {amp} {Rest}},
		\dur, 0.02,
).play;
)
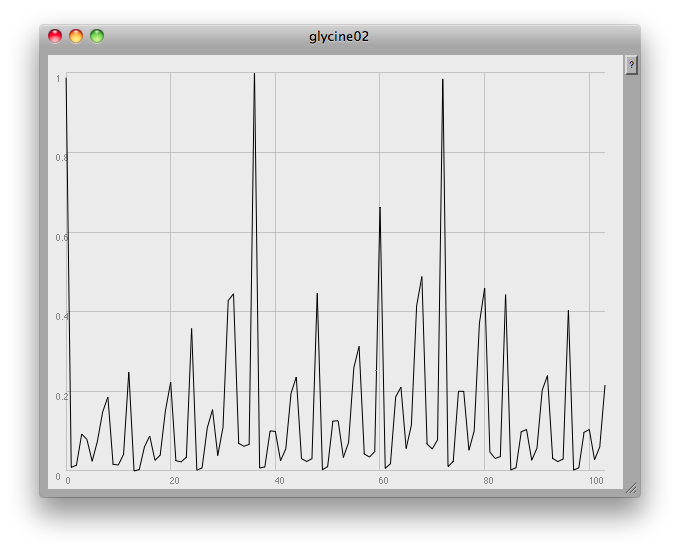
At the very end of the plot you can see one of the problems: this method finds any and all local peaks, including ones which to the eye look unimportant:
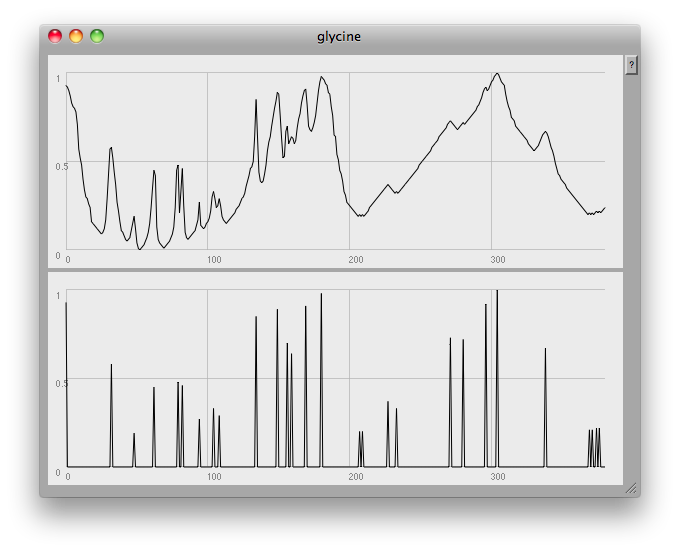
I think what would be needed here would be some low-pass filtering to get rid of small glitches. However, the musical results so far are quite good: once again, here's a short gesture made by crossfading from one compound to another:
