Sonifying IR spectroscopy data - 'chords'
Finding the .resamp1 method in SuperCollider gave me an idea for reducing this rather large set of data into something perhaps more musically useful. Could I make something more like a tonal chord, with pitches repeated in every octave?
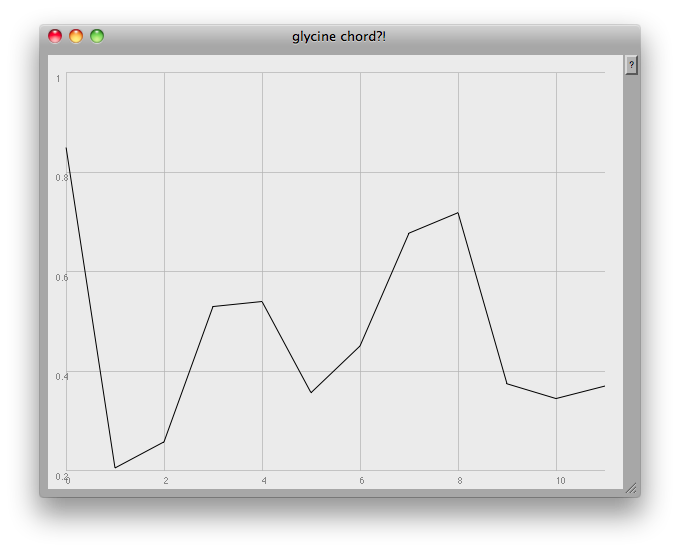
I first drastically resampled my data into just twelve points:
f = ((f.flop[1] * -1) + 1).resamp1(12);

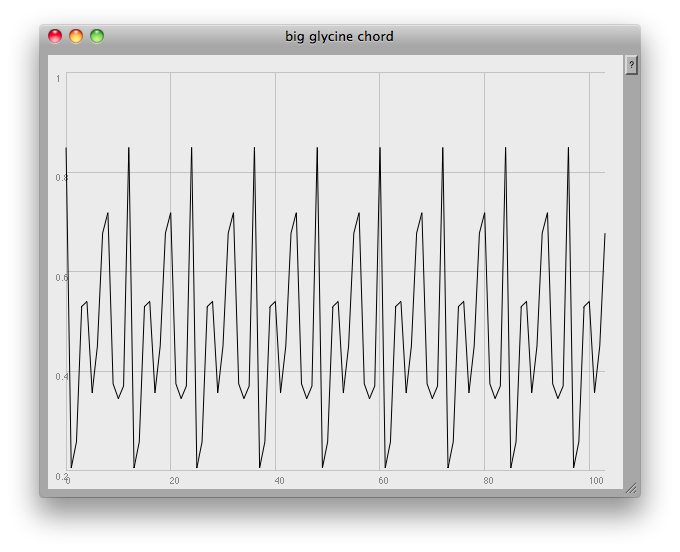
These would then be the probabilities of those twelve pitch classes appearing across a range of eight and a half octaves:
f = (f++f++f++f++f++f++f++f++f[..7]); // 104 notes

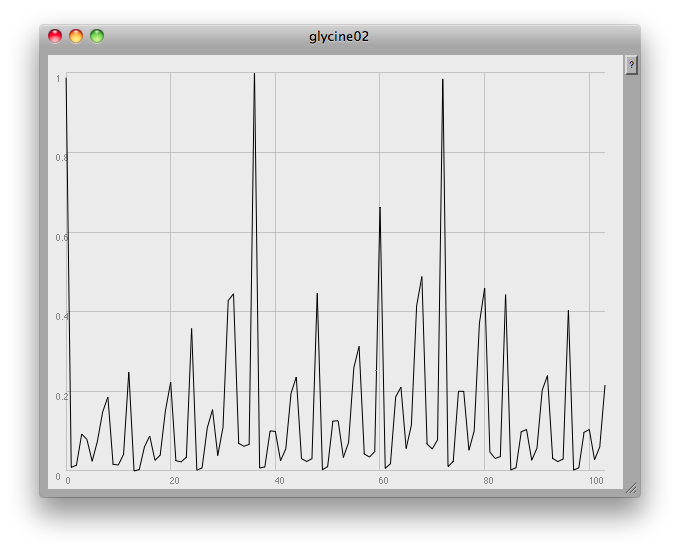
Then what I did was to multiply this chordal structure by the original data, so that my final sound is the 'glycine chord' amplitude modulated (sort of) by the absorbtion data.

Here's the final code:
( ~name = "glycine"; ~path = Document.current.dir.asString++"/"++ ~name ++".csv"; f = CSVFileReader.readInterpret(~path);
g = f;

f = ((f.flop[1] * -1) + 1).resamp1(12);
f = (f++f++f++f++f++f++f++f++f[..7]);
// 104 notes  g = ((g.flop[1] * -1) + 1).resamp1(104);
// 104 samples of orig graph  ~amps = f.cubed * g;
// combining two approaches ~amps = ~amps.normalize;
~amps.plot(~name, Rect(840,0,600,450));
~freqs = (25..128).midicps;

{ Splay.ar(Klank.ar(`[~freqs, ~amps, nil], PinkNoise.ar(0.01))) }.play; )
I used this approach to make the sound below, which crossfades from glycine to tyrosine to water, then back to glycine again.